Guides
Pricing inspections in high-cost and low-cost U.S. metros, a data approach
Inspection prices track local wages, housing age, drive time and permit fees, so build each metro pricing band from its own local cost data.
What to take away
- Price from four local inputsinspector pay, drive time, insurance and overhead, and demand. A national rate card hides all four.
- Los Angeles, Atlanta and Minneapolis-St. Paul sit in different bands, and the gap is cost structure, not inspection quality.
- Census housing data sizes the job; BLS area wage and price series cost it. Both are published by metro.
- Build one floor formula and rerun it per metro instead of rewriting your price list for every new market.
- Hold price while your cost index is flat and your close rate is healthy. Reprice after a cost event, in one step, before the busy season.
Why the same inspection costs different amounts in different metros
An inspector drives to the house, walks the roof and crawlspace, and writes the report in the metro where the client lives. Labor, fuel, parking, insurance and software are all bought locally. The work is similar from city to city. The cost base is not.
A single national price list fails in both directions. In a high-cost metro it leaves money on the table; in a low-cost one it prices you out of your own market.
Volume sets the floor as much as wages do. Dense metros shorten the drive between jobs, so an inspector can fit more work into a day. Sprawling metros stretch the same three inspections across ten hours. Travel is a real cost even when no line on the invoice shows it.
Housing stock decides how long the job runs. A 1920s Minneapolis-St. Paul house with a boiler, a finished basement and cloth wiring takes longer than new construction in an Atlanta subdivision. Price the time the house actually takes, not a generic average.
Seasonality spreads fixed costs unevenly. Northern metros slow in winter while southern metros stay busy. A band built on summer volume will underprice January.
Price bands for Los Angeles, Atlanta and Minneapolis-St. Paul
Use a band, not a single number. A band leaves room for square footage, age, foundation type and add-ons.
Metro inspection price bands
Los Angeles, CA
- Typical band
- $550-$850
- Main cost driver
- High labor, fuel, parking
- Position in band
- Condo low, pool home high
Atlanta, GA
- Typical band
- $350-$550
- Main cost driver
- Moderate labor, crowded market
- Position in band
- Keep tight, add-ons carry
Minneapolis-St. Paul, MN
- Typical band
- $400-$650
- Main cost driver
- Winter access, older housing
- Position in band
- Two systems justify top
Price bands by metro
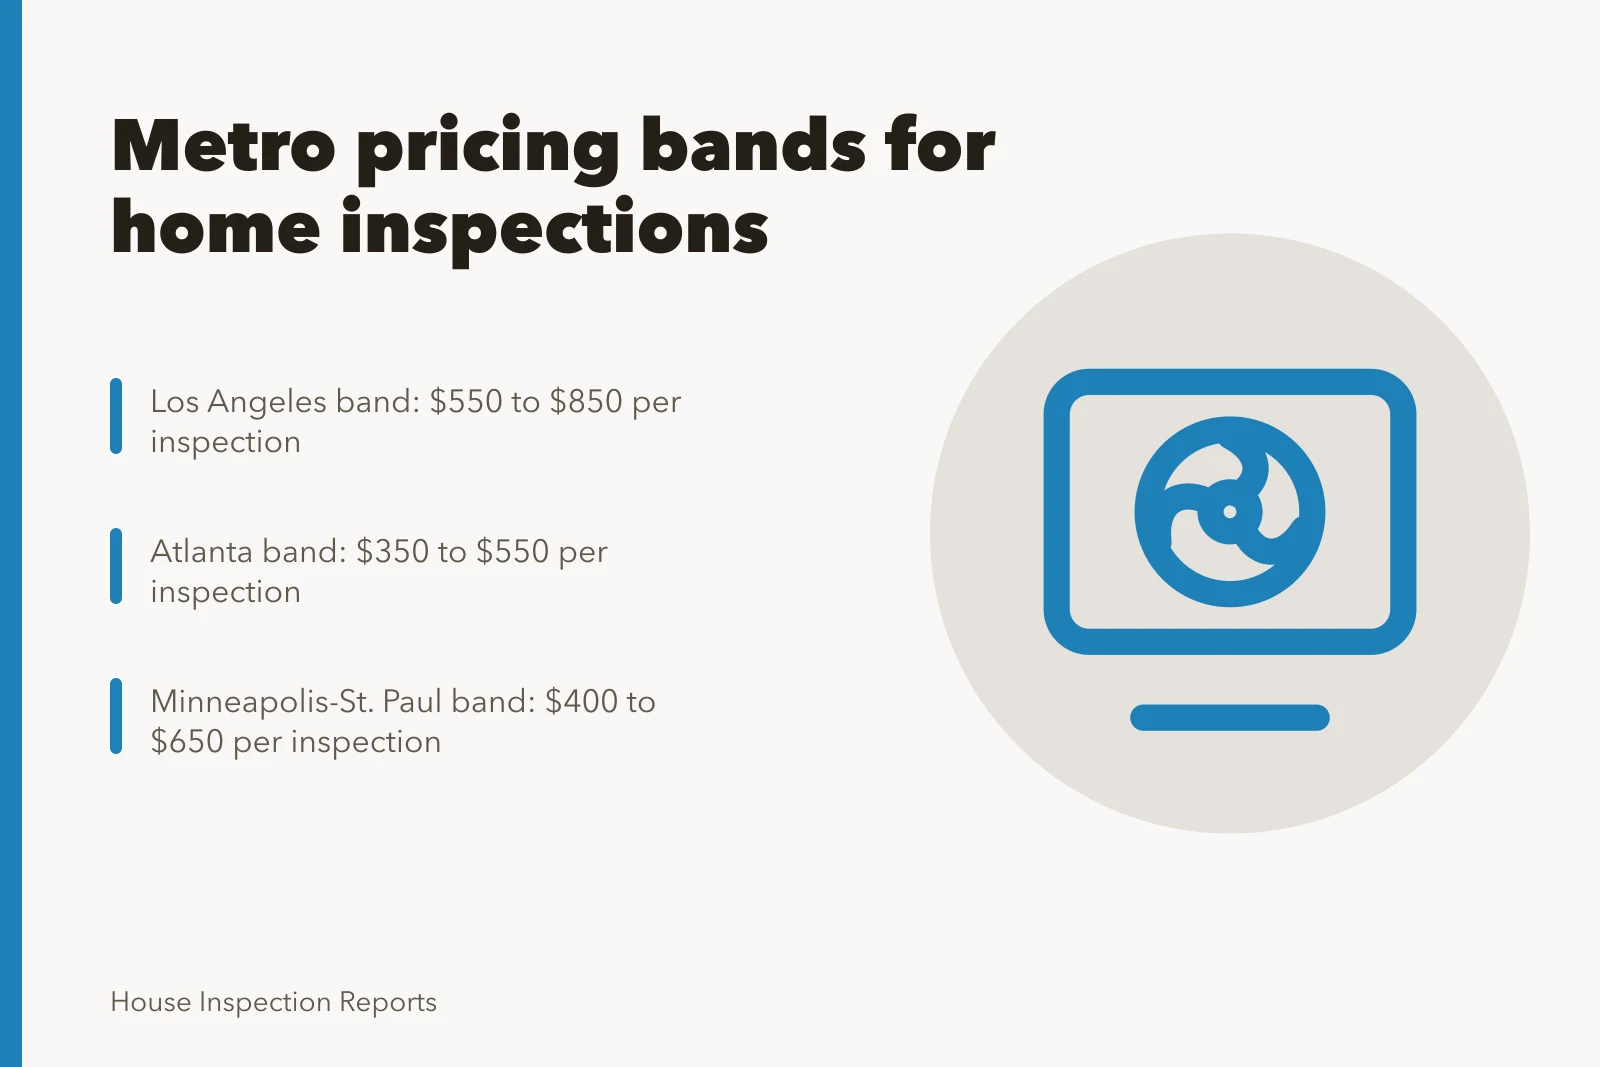
Typical single-family inspection band
- Los Angeles, CA
- $550 to $850
- Atlanta, GA
- $350 to $550
- Minneapolis-St. Paul, MN
- $400 to $650
Main cost driver
- Los Angeles, CA
- High labor, fuel, parking and insurance
- Atlanta, GA
- Moderate labor, crowded market
- Minneapolis-St. Paul, MN
- Winter access, older housing stock
Los Angeles sits at the top because labor and vehicle overhead are high and distant suburbs add drive time. A condo near the bottom of the band, a large older home with a pool or guest house near the top.
Atlanta sits lower on cheaper labor and overhead, and many inspectors compete on price and speed. Keep the band tight there and let the add-on menu carry margin.
Minneapolis-St. Paul lands between the two. Labor is moderate, but winter limits exterior work and older homes take longer. Homes with two heating systems or a finished basement often justify the top of the band.
Treat these as starting points. Your own drive time and service mix move them.
Reading Census housing data and BLS area statistics
Census housing data tells you what you are inspecting. The U.S. Census Bureau publishes housing characteristics by metro: age of structure, single-family versus multi-unit share, and owner-occupied rate.
Census plus BLS pricing method
- Census: age of structure by metro
- Census: single-family vs multi-unit share
- Census: owner-occupied rate
- BLS: wages and employment by area
- BLS: price levels by area
- Pair both: cost floor and demand signal
Older stock means longer inspections and more findings, which supports a higher band. A high owner-occupied rate means more individual buyers ordering inspections; a high renter rate means more investor clients who want a fast, cheap report.
BLS area statistics tell you what the work costs. The Bureau of Labor Statistics publishes wages, employment and price levels by area, using consistent definitions across metros.
That consistency is the point: it lets you compare a band in one city against a band in another without comparing guesses.
The BLS overview of statistics by geography lists which series are published at metro level.
Pair the two. Census sizes the job, BLS prices it. Neither tells you what to charge, but together they give you a cost floor and a demand signal, which is what a defensible rate is built on.
The four inputs behind every band
Inspector pay. The largest input. BLS occupational data gives wage and employment figures by occupation and area, so you can set a realistic pay target before you set a price.
Four inputs behind every band
- Inspector paylargest input, use BLS wage data
- Vehicle and travelfuel, tolls, parking, distance
- Insurance and overheadliability, software, licensing
- Demandhot market supports top of band
If local data shows a tight market for skilled trades, your band has to fund the pay or you will not keep good inspectors. Our notes on wages and the real cost work through what that pay actually costs a firm.
Vehicle and travel. Fuel, tolls, parking and distance. Los Angeles traffic and parking can add an hour to a job. Atlanta sprawl adds miles. Minneapolis-St. Paul winter adds idling and snow tires. Track your cost per inspection, not a national average.
Insurance and overhead. Liability coverage, software, continuing education, licensing. The BLS overview of business cost statistics helps you benchmark overhead categories against industry norms. If your overhead runs above your metro's norm, the band has to cover it or the margin shrinks. Firms planning a year ahead can also work from the BLS resources for business leaders.
Demand. The ceiling. A hot market with few inspectors supports the top of the band; a soft market with many pushes toward the floor. Local listing volume is a usable proxy.
A worked floor calculation
Here is the arithmetic for a single-inspector firm in Minneapolis-St. Paul. Substitute your own figures.
Minneapolis floor calculation
- $85,000Target annual pay
- 500Billable inspections per year
- $60Direct cost per inspection
- $288Revenue floor per inspection
Revenue floor per inspection = (target pay / inspections) + direct cost, then multiplied by 1.25.
($85,000 / 500) + $60 = $230. Times 1.25 = $288.
Your band starts above $288. Run the same formula in Los Angeles with higher pay and higher direct costs and the floor climbs fast. Run it in Atlanta and it drops. The arithmetic never changes; the inputs do.
Building a model that travels between metros
A model that travels is a set of rules, not a price list. Build it once and feed it local data.
Build a portable pricing model
- Define the base service and report turnaround
- Set a local cost index from BLS data
- Calculate the floor per metro
- Apply a demand multiplier
- Publish a band and add-on menu
The rules stay fixed while the inputs change, so entering a new metro means updating the index, not rewriting your pricing philosophy. Keep the model small enough to explain to a new inspector in five minutes; complexity hides errors.
Review it quarterly. Wages, fuel and insurance all move, and a model built last year can price below cost this year. A monthly KPI routine tracking average price, close rate and cost per inspection will flag the drift early.
When to hold price and when to reprice
Hold price while your cost index is flat and your close rate is healthy. If you are booking several days out and losing fewer than a quarter of quotes, you have room.
Reprice after a cost event: an insurance renewal, a licensing fee change, a fuel spike. Pass it through with a one-line explanation. A drop in local listing volume is a demand event, not a cost event, so consider holding price and competing on turnaround instead.
In a new market, do not copy the local average. The average may be set by inspectors who are undercharging. Build your floor from local data, then position inside the band on service level. The accounting behind that floor is worked through in our guide to where home inspection profit comes from.
Watch the low-cost-metro trap. Atlanta prices look low because Atlanta costs are low. Import Los Angeles overhead into an Atlanta band and you lose money on every job.
Move in steps. A ten percent increase is easier for agents and repeat clients to accept than a thirty percent jump. Announce before the busy season, never during it.
Presenting the number to agents and buyers
Lead with the band and what it covers, then give one local reason it sits where it does: "The base inspection is $525 for homes up to 2,500 square feet with a standard report. Older boilers and finished basements here add time, which is why the range tops out higher."
Use a quote template that lists the base price, the common add-ons and what triggers each one. Buyers accept add-ons they understand, and clear add-on pricing cuts haggling.
Energy is part of the conversation. The EIA Residential Energy Consumption Survey documents how homes use energy, which supports the efficiency notes you write into reports.
For agents, frame price as risk management. A thorough inspection that catches a failing system protects the agent from a later complaint. Cheap inspections that miss problems cost more later. That argument holds in every metro.
Keep a one-page sheet per market with the band, the add-ons and the local factors that move price. Update it when the index moves. It doubles as a training tool.
Common questions
Why can't I use one national price for home inspections?
Because labor, fuel, insurance and housing stock differ by metro. A single price either overcharges in a low-cost market or loses money in a high-cost one.
How often should I update metro price bands?
At least quarterly. Wages, insurance and fuel move through the year, and a band that was right in January can sit below cost by October.
What if a new metro has no published inspection wage data?
Use BLS occupational data for related trades and local price levels as a proxy, then correct with your own cost per inspection after your first month of work.
Should I charge more for older homes?
Yes, when they take longer. Census housing data shows the age of the local stock, which helps you set a band that reflects the extra time.